You’ve got a model running. responds. The hello-world works. Now put it behind an API, point real traffic at it, and watch what breaks.
The tutorials stop at it works. Production starts at it works until it doesn’t.
After a year running local LLMs in production — from a single GPU to a fleet handling bursty RAG and agent workloads — the pattern is clear: the engineering that matters isn’t model selection. It’s the operational discipline that turns a demo into a service.
Grandma-test difficulty: 2/5 — You need a GPU, a terminal, and the discipline to measure before you optimize. Try-it time: One evening to instrument, one week to load-test properly. Worth your time: 5/5 — Do Not Miss
The Mental Model You’re Missing
Every LLM request is two completely different workloads [S1][S2]:
Prefill (compute-bound): The prompt hits the model. All tokens process in parallel through attention layers. Matrix multiplication — GPU cores saturated. Time-to-first-token lives here.
Decode (memory-bandwidth-bound): Tokens generate one at a time. Each step reads model weights plus the growing KV cache. Data movement dominates. Tokens-per-second lives here.
Most advice conflates them. If your latency problem is prefill, KV cache quantization does nothing. If it’s decode, flash attention won’t help. Measure first.
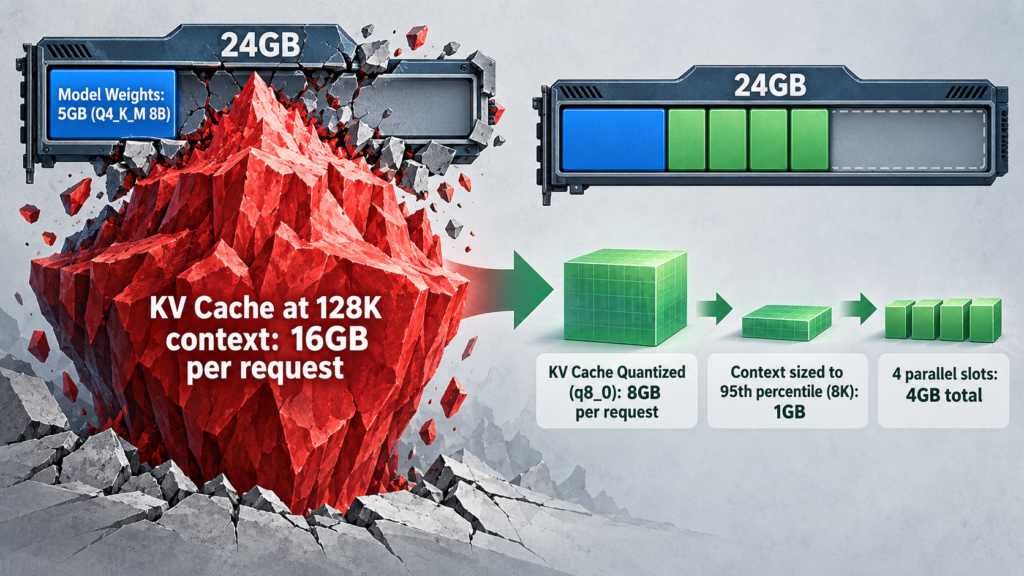
The KV cache is the silent VRAM killer. At f16 precision, each token costs 2 bytes per layer per head. For Llama 3.1 8B (32 layers, 32 heads, 128 head dim): ~2 MB per 1K tokens. At 128K context that’s ~16 GiB per request — more than the 5 GB model weights [S1][S2]. Multiply by parallel slots and you see why set context to max OOMs GPUs [S1].
The Six Knobs That Actually Move the Needle
Ollama exposes 15+ variables. vLLM has dozens of flags. Most don’t matter. These six do [S1][S5]:
1. Context Length: Set to Your 95th Percentile, Not the Maximum
in Ollama, in llama.cpp, in vLLM. Tutorials say set it to max. That’s the #1 bug [S1]. As Mustafa Genc writes: The tutorials say ‘set this to the model’s maximum supported context.’ The tutorials are wrong in a way that will OOM your GPU.
Worked example: 24 GB GPU, Llama 3.1 8B at Q4_K_M (~5 GB weights), CUDA overhead ~1.5 GB. Available for KV cache: ~17 GB.
| Context | f16 KV/req | 1 slot | 4 slots | |———|————|——–|———| | 128K | ~16 GiB | barely | OOM 64 GiB | | 32K | ~4 GiB | OK | barely 16 GiB | | 8K | ~1 GiB | OK | 4 GiB |
Your 95th-percentile prompt is probably under 8K. Measure it. Don’t guess [S1].
2. The Two-Instance Pattern
If you occasionally need long context, don’t run one bloated instance. Run two [S1]:
- Instance A (short, high concurrency): , (or , in vLLM). Handles 95% of traffic.
- Instance B (long, low concurrency): , . Handles outliers.
Route at the application layer based on prompt length. The alternative is rare 100K-token prompts starving every other request [S1].
3. KV Cache Quantization: On by Default, Verify on Your Evals
Quantizing the KV cache (q8_0 in Ollama/llama.cpp, fp8 in vLLM on H100/A100/RTX 4090/5090) roughly halves KV memory [S1][S3].
Quality impact is small on chat, classification, RAG, summarization. Shows up in reasoning/code. Validate on your evals [S1][S3]. Q4_K_M is the practical sweet spot (~1-3% loss vs FP16 at ~25% size) [S6].
4. Keep-Alive: Match Your Traffic Pattern
default unloads after 5 min idle. On sporadic traffic (request every 6 min), every request pays 5-15s cold start [S1].
Three strategies:
- **** (indefinite) — Dedicated nodes. Model stays resident. Right default for 90% of services.
- **** — Shared nodes. Resident during business hours, evicted overnight.
- **** (immediate unload) — Batch jobs cycling through models. Prevents VRAM fragmentation.
vLLM keeps models loaded. Plan VRAM accordingly [S1].
5. Prefix Caching: Enable When You Have Shared Prefixes
System prompts, RAG chunks, few-shot examples — if requests share prefixes, prefix caching reuses prefill [S1][S4].
Ollama has no cross-request prefix cache — a gap for production RAG [S1]. SGLang’s RadixAttention yields 6x on RAG pipelines [S4].
Cost: prefix cache lives in KV pool. Enable only when you have measurable prefix sharing [S1].
6. Parallelism/Concurrency: Right-Size for Your Hardware
Ollama: (default 1). Each slot = full context.
vLLM: (default 256). Soft limit; real constraint is VRAM.
Combined recipe for most deployments [S1]:
- Weights: Q4_K_M or Q5_K_M (F16 only if benchmarked)
- KV cache: q8_0 / fp8
- Flash attention: on
Cuts VRAM ~50% versus defaults without measurable quality loss [S1].
Runtime Selection: The Layer Model
Stop asking Ollama or vLLM? They’re different layers [S3][S4][S5]:
| Layer | Tools | Purpose | |——-|——-|———| | Dev UX | Ollama, LM Studio, Jan, GPT4All, Open WebUI | One-command start, model mgmt, single-user prototyping | | Inference Engine | llama.cpp, Apple MLX, ExLlamaV3, MLC-LLM | Raw inference; everything above wraps these | | Production Serving | vLLM, SGLang, LMDeploy, Aphrodite | Multi-user concurrency, GPU-optimized batching | | Datacenter Scale | TensorRT-LLM + Triton | Max NVIDIA throughput; 28-min compile |
Decision framework [S4][S5]:
- Solo dev prototyping -> Ollama (fastest start, widest integrations)
- Prefer GUI -> Jan (Apache 2.0, zero telemetry) or LM Studio (polished)
- CPU-only / no GPU -> llama.cpp directly, or GPT4All
- Apple Silicon max perf -> mlx-lm standalone, or Ollama 0.40+ (uses MLX) [S7]
- 10+ concurrent users / production API -> vLLM (baseline choice)
- RAG / agentic workflows -> SGLang (RadixAttention = 20-30% cost reduction)
- Multiple models from one process -> SGLang or LMDeploy (vLLM can’t)
- Diverse quant formats (EXL2, GGUF, AWQ, FP8) -> Aphrodite Engine
- NVIDIA datacenter scale -> TensorRT-LLM + Triton (accept 28-min compile)
Pick the simplest system that meets targets. Test at 3x load. Only move up when data forces you [S1][S5]. As the AI System Design Guide notes: Ollama and LM Studio serialize, vLLM batches continuously and pages the KV cache. For one user the difference is small; under concurrency it becomes roughly 16-20x.
Minimum Viable Observability
You cannot operate what you cannot see. Instrument from day one [S1]:
Per-request (Ollama returns in and ):
- (prefill time)
- (decode time)
- (prefill tokens)
- (decode tokens)
- Derived: TTFT = , tok/s =
Per-instance:
- GPU VRAM ()
- GPU utilization (10s windows)
- Loaded models ( in Ollama)
- Active request count
- Pending queue depth (instrument at reverse proxy)
Per-request logging that matters:
- Tokenized prompt length (not string length)
- Truncation flag:
Log these. Chart them. They are your ground truth [S1].
Load Testing: Real Traffic or Nothing
Vendor benchmarks use uniform 128/512 token prompts, dense concurrency, idealized hardware [S1]. Your traffic:
- Prompt lengths: 50 to 20K tokens, long tail
- Output lengths: 10 to 4K tokens, varying by task
- Bursty concurrency with minutes of quiet between spikes
- Heavy prefix sharing (RAG) OR none (summarization)
- Real NUMA, background processes, restarts that wipe warmup
The protocol [S1]:
- Capture real traffic. Log prompts for a week.
- Replay it. Feed into locust, k6, or asyncio. Real prompts, real timing.
- Measure right. p50, p95, p99 latency and throughput over 10-min windows.
- Change one thing at a time. Don’t tweak five knobs and celebrate.
- Test beyond comfort. Run at 2x expected peak.
Production lands at 30-60% of advertised throughput with 3-5x higher p99 [S1].
Reference Configurations
Solo dev / small team on single GPU (A100 40GB / RTX 4090 24GB):
Production API (>50 RPS, sub-second p99) on NVIDIA:
Apple Silicon team server (Mac Studio M2 Ultra 128GB):
Rollback Checklist
When a config change degrades things:
- Revert the single knob you changed.
- Verify VRAM didn’t creep ( before/after).
- Check queue depth — throughput up but queue exploding is a regression.
- Re-run 10-min load test. Compare p99, not averages.
- Can’t identify regression in 15 min? Roll back the whole config set.
One Thing to Know
The runtime is not the product. Users don’t care what you run. They care that responses are fast, consistent, and correct. A well-tuned Ollama beats a poorly configured vLLM every time [S1][S5]. The real engineering is in tuning, observability, and routing — not picking a tool.
The Bottom Line
Try this tonight if: You have a local model serving real traffic and you’ve never measured prefill vs decode separately, never set context to your actual 95th percentile, never load-tested with real traffic.
Skip if: You’re still at the does it run? stage. Hello-world doesn’t need this playbook.
The gap between it works and it survives production is operational discipline. The knobs are finite. The math is learnable. Use the playbook, measure everything, and stop guessing [S1].
Sources
- [S1] I Deployed Local LLMs in Production for a Year. Here's What the Tutorials Don't Tell You — Part 2: The Operational Playbook — AI Advances / Medium (2026-05-04)
- [S2] I Deployed Local LLMs in Production for a Year. Here's What the Tutorials Don't Tell You — Part 1: The Mental Model — AI Advances / Medium (2026-05-04)
- [S3] On-Device and Edge Deployment — AI System Design Guide (ombharatiya/ai-system-design-guide) (2026-09-23)
- [S4] The Complete Guide to Local LLM Inference Tools in July 2026: llama.cpp, Ollama, vLLM, SGLang, and Beyond — DEV Community (2026-07-01)
- [S5] Ollama vs vLLM: A Comprehensive Guide to Local LLM Serving — Medium (2026-08-15)
- [S6] Self-Hosted LLM Guide 2026: Run AI Locally for Privacy & Savings — sanj.dev (2026-06-20)
- [S7] Running LLMs Locally in 2026: A Step-by-Step Setup Guide for Ollama, llama.cpp, and vLLM — acingai.com (2026-07-15)